
How to Read an Options Chain Without Your Eyes Glazing Over
Part of Options Trading, From the Beginning
By Paul Peery · August 9, 2026 · 5 min readUpdated August 13, 2026
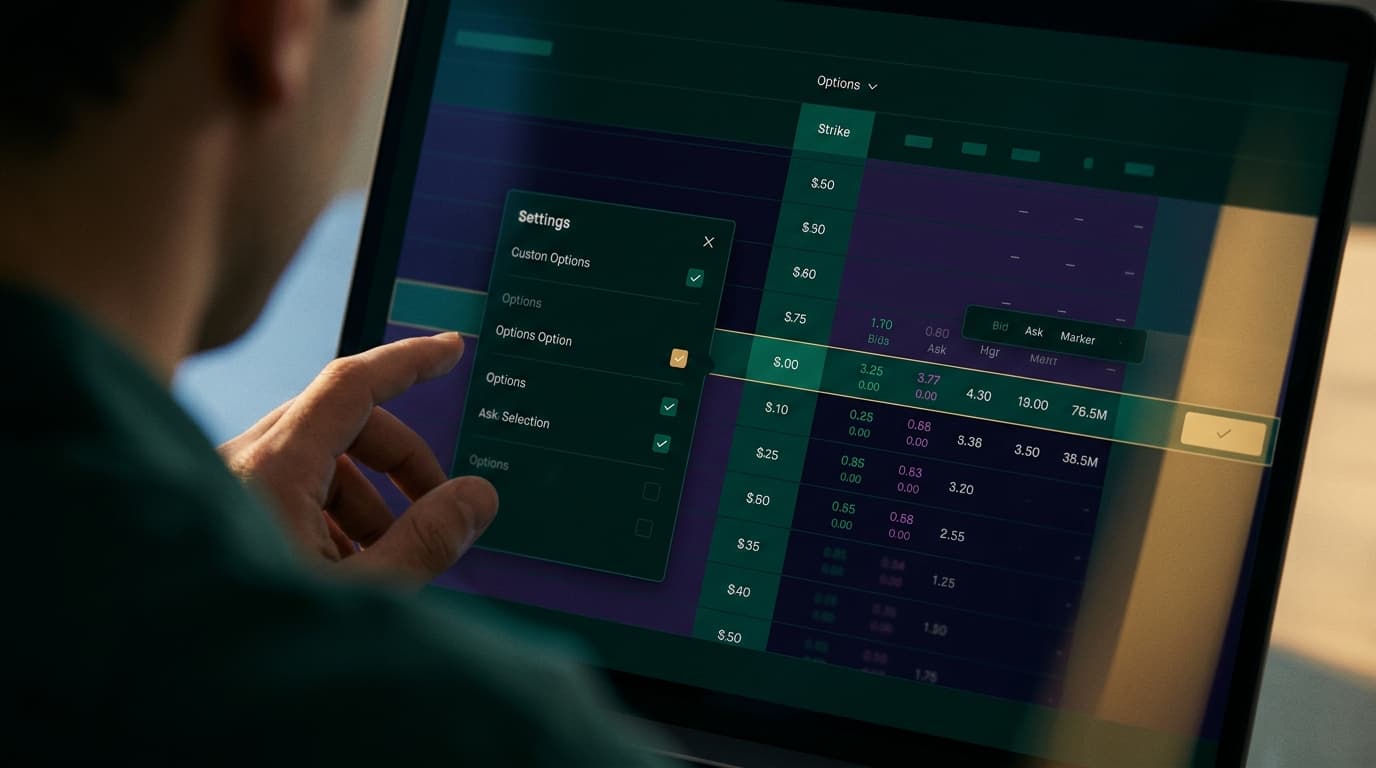
(Educational note: Everything below is for educational purposes only and is not financial advice.)
An options chain looks like an impenetrable financial spreadsheet designed by committee, but most of those numbers exist to distract you from whether a trade is actually usable. When you open a platform like Schwab, Fidelity, or Tastytrade, you are greeted by dozens of columns—implied volatility, vega, gamma, IV rank, last price, volume, ask size, bid size, and strike after strike. If you try to analyze every column at once, analysis paralysis wins every time.
Before diving into specific strategies like sizing risk on options trades or evaluating short-term contracts, you need a mental filter. Here is how the grid is structured, which four data points actually matter before entering an order, and what you can safely ignore.
The center column divides calls from puts
Every options chain is arranged around a central column of strike prices, ordered vertically from lowest to highest. Call options sit on the left side of that center column, and put options sit on the right side.
The table is further split horizontally by expiration date. When you click an expiration date—say, 30 days from today—the chain opens to show every strike price available for that specific date.
Most platforms shade the rows to show "moneyness." If a stock is trading at $100, call strikes below $100 are in-the-money (and shaded), while call strikes above $100 are out-of-the-money. For puts, it is the exact opposite: strikes above $100 are shaded in-the-money, and strikes below $100 are out-of-the-money. If you need a refresher on these foundational definitions, read my guide on options basics for complete beginners.
Understanding this T-shape layout takes thirty seconds. The real skill is knowing where your eyes should go next.
Bid and ask prices reveal what execution actually costs
Never look at the "Last" price column. An option contract might show a last traded price of $2.50, but that trade could have happened three hours ago when the underlying stock was at a completely different price.
The only prices that matter are the Bid (what buyers are offering) and the Ask (what sellers are asking for). The gap between them is the bid-ask spread, and it represents a hidden transaction fee every time you enter or exit a trade.
Imagine a stock trading near $100. You look at a $105 call option expiring next month:
- Bid: $1.20
- Ask: $1.30
The spread here is $0.10. Since one option contract covers 100 shares, entering at the Ask ($1.30) and immediately closing at the Bid ($1.20) would cost you $10 per contract in slippage. If the Bid were $1.00 and the Ask were $1.50, that $0.50 spread means you lose $50 the moment you open the position.
If the bid-ask spread is wider than 10% of the option's value, I usually walk away. Tight spreads mean market makers are actively competing, allowing you to fill limit orders near the midpoint (in this example, $1.25).
Volume and open interest show if liquidity is real
A tight bid-ask spread on paper means nothing if nobody is trading the contract. That is why volume and open interest must be checked together.
Volume measures how many contracts have changed hands today. Open interest measures the total number of active, open contracts that currently exist in the market.
Think of volume as daily foot traffic through a shop and open interest as total current active leases in the building:
- High open interest, high volume: The contract is liquid. Market makers are active, order fills are fast, and spreads stay narrow.
- Low open interest, low volume: You are trading in a ghost town. You might get in, but getting out later will require giving up a huge chunk of your profit to a market maker.
As a general rule, I look for open interest of at least 500 to 1,000 contracts on the strike I am considering. If open interest is double digits, getting filled at a fair price becomes an uphill battle, especially if you are dealing with fast-moving expiration cycles like same-day 0DTE options.
Delta and theta are the two Greeks worth checking first
Options platforms offer half a dozen "Greeks" (mathematical sensitivity metrics), but you only need two to evaluate a standard directional or income trade: Delta and Theta.
Delta tells you two practical things. First, it estimates how much the option price moves for every $1 move in the underlying stock. A call option with a 0.35 Delta gains roughly $0.35 in value if the stock rises by $1. Second, traders use Delta as a rough proxy for the probability of expiring in-the-money. A 0.35 Delta call has roughly a 35% estimated chance of finishing above the strike price by expiration.
Theta tells you daily time decay. Options lose value as expiration approaches, and Theta states the dollar amount lost each day, assuming stock price and volatility stay constant. A Theta of -0.04 means the contract loses $0.04 per share ($4 per contract) every 24 hours just from the calendar turning.
If you are buying options, high Theta works against you every night you hold the trade. If you are selling options to collect income, Theta is the force working in your favor.
The honest truth about what you can ignore
Here is the reality: staring at theoretical options pricing models will not protect you from stock-specific news or unexpected market gaps. Spending ten minutes agonizing over Gamma or Vega on a routine 30-day option trade usually adds confusion without improving your edge.
When scanning an options chain, I completely hide or ignore:
- Last Price: Stale data that tricks you into mispricing orders.
- Gamma and Rho: Gamma measures the rate of change of Delta (useful for complex market-making, overkill for simple trades). Rho measures interest rate sensitivity, which barely moves short-term options prices.
- Theoretical Values: Model calculations derived from mathematical formulas that do not account for immediate supply and demand in the order book.
A 4-point pre-flight checklist for scanning the chain
Instead of trying to absorb fifty columns of data, run this simple sequence every time you open an option chain:
- Check Expiration & Strike: Locate your target date and move to the center column to pick your strike.
- Check Bid-Ask Spread: Ensure the gap between Bid and Ask is narrow (ideally within $0.05 to $0.10 on lower-priced contracts).
- Check Open Interest: Verify open interest is at least several hundred contracts so you know liquidity exists.
- Check Delta & Theta: Confirm Delta aligns with your directional bias or probability target, and check daily time decay via Theta.
If an option contract passes those four checks, you have all the information required to set a limit order and manage your risk properly.
Keep reading
All posts
Understanding Option Greeks: The Only Two Beginners Need to Track
You do not need to memorize five Greek letters to trade your first option. Here is why tracking Delta and Theta gives you almost everything you need.
August 27, 2026 · 4 min read